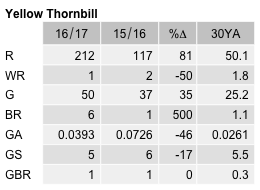
Yellow Thornbill
Acanthiza nana
ABR description
The following is extracted from the Annual Bird Report for the twelve months to June 2017.
Uncommon, breeding resident
Least common resident thornbill, generally found in densely branching undergrowth such as wattle trees.
General: There is some good news this year for this species. As well as increased records, bird numbers are up 60% on last year, more than twice the 10YA and over 3x the 30YA. Reporting rate (1.5%) is up 50% on last year, about the same as the 10YA (1.4%) but just under the 30YA (1.8%). Similarly, the abundance is climbing a little off the bottom of the chart. Max 16/27 Jan LBath GrZ08 (LeM1), mean 2.7 and median 2. Reported regularly throughout the year with slightly more in spring (26%) and autumn (30%). 7 breeding records: first nb/18 Aug The Pinnacle NR (AlB1) and last dy/5 Jan JWNR (LeM1).
GBS: 41% decrease from last year to 55 records from 3 suburban (Lyneham, Giralang and Curtin) and 2 rural sites (Carwoola and Wamboin), 9% of sites, from 39 weeks, essentially the same as last year. Fewest records in spring, most in autumn (33%) with 26% in winter and 24% in summer. Abundance (A=0.0393) is down 46% on last year but up 45% on the 10YA, and even more on the 30YA. Max 5/1wk Feb Wamboin (CoK2), mean 1.8, median 2. A single breeding record: nb/2wk Sep Curtin (AjR1).
Abundance
Abundance is the average number of birds of that species per survey. Where the species was observed (presence recorded) but the number of birds seen was not recorded, this is treated as a count of zero.
Abundance by year
This chart shows the abundance of Yellow Thornbill between 1982 and 2017. 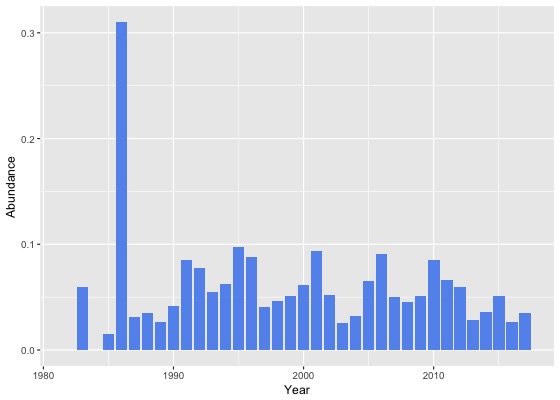
Abundance by month
This chart shows the monthly abundance of Yellow Thornbill. The blue lines show the abundance for the twelve months to June 2017 and the bars show the average abundance for the period 1982 to 2017. 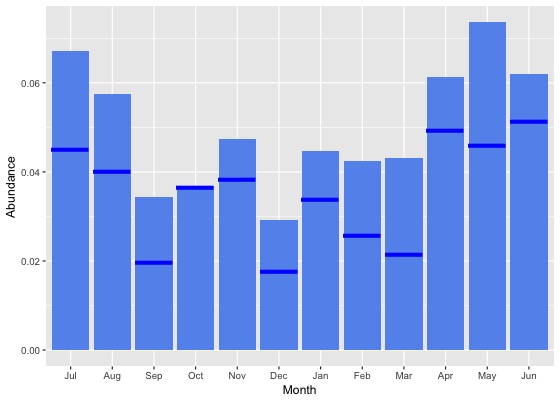
Abundance by season
This chart shows the seasonal abundance of Yellow Thornbill. The blue lines show the seasonal abundance for the twelve months to June 2017 and the bars show the average seasonal abundance for the period 1982 to 2017. 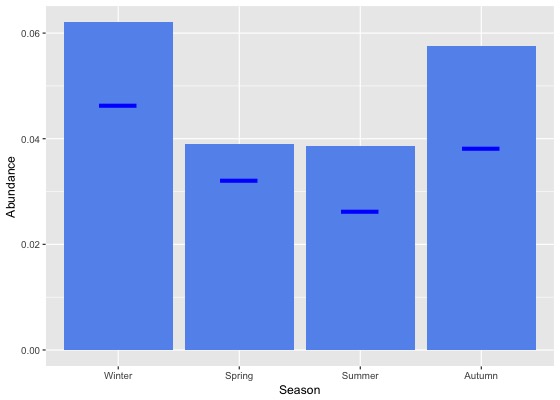
Abundance data
| Month | Season | ||||||||||||||||||
|---|---|---|---|---|---|---|---|---|---|---|---|---|---|---|---|---|---|---|---|
| Period | Jul | Aug | Sep | Oct | Nov | Dec | Jan | Feb | Mar | Apr | May | Jun | Winter | Spring | Summer | Autumn | All | ||
| All years | |||||||||||||||||||
| All | 0.1 | 0.1 | 0.0 | 0.0 | 0.0 | 0.0 | 0.0 | 0.0 | 0.0 | 0.1 | 0.1 | 0.1 | 0.1 | 0.0 | 0.0 | 0.1 | 0.0 | ||
| Previous years | |||||||||||||||||||
| All previous years | 0.1 | 0.1 | 0.0 | 0.0 | 0.0 | 0.0 | 0.0 | 0.0 | 0.0 | 0.1 | 0.1 | 0.1 | 0.1 | 0.0 | 0.0 | 0.1 | 0.1 | ||
| Previous 30 years | 0.1 | 0.1 | 0.0 | 0.0 | 0.0 | 0.0 | 0.0 | 0.0 | 0.0 | 0.1 | 0.1 | 0.1 | 0.1 | 0.0 | 0.0 | 0.1 | 0.0 | ||
| Previous 20 years | 0.1 | 0.1 | 0.0 | 0.0 | 0.0 | 0.0 | 0.0 | 0.0 | 0.0 | 0.1 | 0.1 | 0.1 | 0.1 | 0.0 | 0.0 | 0.1 | 0.0 | ||
| 10 year groups | |||||||||||||||||||
| [2007,2017) | 0.1 | 0.1 | 0.0 | 0.0 | 0.0 | 0.0 | 0.0 | 0.0 | 0.0 | 0.1 | 0.1 | 0.0 | 0.1 | 0.0 | 0.0 | 0.1 | 0.0 | ||
| [1997,2007) | 0.1 | 0.1 | 0.0 | 0.0 | 0.1 | 0.0 | 0.1 | 0.0 | 0.1 | 0.1 | 0.1 | 0.1 | 0.1 | 0.0 | 0.0 | 0.1 | 0.1 | ||
| [1987,1997) | 0.1 | 0.1 | 0.0 | 0.0 | 0.0 | 0.1 | 0.0 | 0.0 | 0.1 | 0.0 | 0.1 | 0.1 | 0.1 | 0.0 | 0.0 | 0.1 | 0.1 | ||
| 5 year groups | |||||||||||||||||||
| [2012,2017) | 0.1 | 0.1 | 0.0 | 0.0 | 0.0 | 0.0 | 0.0 | 0.0 | 0.0 | 0.1 | 0.1 | 0.0 | 0.0 | 0.0 | 0.0 | 0.0 | 0.0 | ||
| [2007,2012) | 0.1 | 0.1 | 0.0 | 0.0 | 0.0 | 0.0 | 0.1 | 0.1 | 0.0 | 0.1 | 0.1 | 0.1 | 0.1 | 0.0 | 0.1 | 0.1 | 0.1 | ||
| [2002,2007) | 0.0 | 0.1 | 0.0 | 0.0 | 0.1 | 0.0 | 0.0 | 0.0 | 0.1 | 0.1 | 0.1 | 0.1 | 0.1 | 0.0 | 0.0 | 0.1 | 0.1 | ||
| [1997,2002) | 0.2 | 0.1 | 0.0 | 0.0 | 0.1 | 0.0 | 0.1 | 0.1 | 0.1 | 0.1 | 0.1 | 0.1 | 0.1 | 0.0 | 0.1 | 0.1 | 0.1 | ||
| [1992,1997) | 0.1 | 0.1 | 0.1 | 0.0 | 0.0 | 0.1 | 0.0 | 0.0 | 0.1 | 0.0 | 0.1 | 0.1 | 0.1 | 0.0 | 0.1 | 0.1 | 0.1 | ||
| [1987,1992) | 0.0 | 0.0 | 0.0 | 0.1 | 0.0 | 0.0 | 0.0 | 0.1 | 0.0 | 0.0 | 0.1 | 0.1 | 0.0 | 0.0 | 0.0 | 0.0 | 0.0 | ||
| Year | |||||||||||||||||||
| 2017 | 0.0 | 0.0 | 0.0 | 0.0 | 0.0 | 0.0 | 0.0 | 0.0 | 0.0 | 0.0 | 0.0 | 0.1 | 0.0 | 0.0 | 0.0 | 0.0 | 0.0 | ||
| 2016 | 0.0 | 0.1 | 0.0 | 0.0 | 0.0 | 0.0 | 0.0 | 0.0 | 0.0 | 0.0 | 0.0 | 0.0 | 0.0 | 0.0 | 0.0 | 0.0 | 0.0 | ||
| 2015 | 0.1 | 0.1 | 0.1 | 0.0 | 0.1 | 0.0 | 0.0 | 0.0 | 0.0 | 0.0 | 0.0 | 0.1 | 0.1 | 0.1 | 0.0 | 0.0 | 0.1 | ||
| 2014 | 0.1 | 0.0 | 0.0 | 0.0 | 0.0 | 0.0 | 0.0 | 0.0 | 0.0 | 0.1 | 0.1 | 0.0 | 0.0 | 0.0 | 0.0 | 0.1 | 0.0 | ||
| 2013 | 0.0 | 0.0 | 0.0 | 0.0 | 0.1 | 0.0 | 0.0 | 0.0 | 0.0 | 0.1 | 0.1 | 0.0 | 0.0 | 0.0 | 0.0 | 0.0 | 0.0 | ||
| 2012 | 0.1 | 0.0 | 0.0 | 0.1 | 0.0 | 0.0 | 0.1 | 0.1 | 0.1 | 0.1 | 0.1 | 0.1 | 0.0 | 0.0 | 0.1 | 0.1 | 0.1 | ||
| 2011 | 0.1 | 0.2 | 0.1 | 0.0 | 0.1 | 0.0 | 0.1 | 0.1 | 0.0 | 0.0 | 0.1 | 0.0 | 0.1 | 0.1 | 0.1 | 0.1 | 0.1 | ||
| 2010 | 0.1 | 0.1 | 0.0 | 0.1 | 0.0 | 0.0 | 0.0 | 0.1 | 0.1 | 0.2 | 0.3 | 0.1 | 0.1 | 0.0 | 0.0 | 0.2 | 0.1 | ||
| 2009 | 0.0 | 0.0 | 0.0 | 0.1 | 0.1 | 0.1 | 0.0 | 0.0 | 0.1 | 0.1 | 0.0 | 0.0 | 0.0 | 0.0 | 0.0 | 0.1 | 0.1 | ||
| 2008 | 0.1 | 0.0 | 0.0 | 0.0 | 0.0 | 0.1 | 0.1 | 0.0 | 0.0 | 0.1 | 0.2 | 0.0 | 0.0 | 0.0 | 0.1 | 0.1 | 0.0 | ||
| 2007 | 0.1 | 0.1 | 0.0 | 0.0 | 0.0 | 0.0 | 0.1 | 0.1 | 0.0 | 0.0 | 0.1 | 0.1 | 0.1 | 0.0 | 0.1 | 0.1 | 0.1 | ||
| 2006 | 0.2 | 0.1 | 0.0 | 0.0 | 0.0 | 0.0 | 0.1 | 0.0 | 0.2 | 0.1 | 0.1 | 0.2 | 0.2 | 0.0 | 0.0 | 0.1 | 0.1 | ||
| 2005 | 0.0 | 0.2 | 0.1 | 0.1 | 0.1 | 0.0 | 0.0 | 0.0 | 0.1 | 0.1 | 0.0 | 0.1 | 0.1 | 0.1 | 0.0 | 0.1 | 0.1 | ||
| 2004 | 0.0 | 0.0 | 0.1 | 0.0 | 0.0 | 0.0 | 0.1 | 0.1 | 0.0 | 0.1 | 0.1 | 0.0 | 0.0 | 0.0 | 0.0 | 0.0 | 0.0 | ||
| 2003 | 0.1 | 0.0 | 0.0 | 0.0 | 0.0 | 0.0 | 0.0 | 0.0 | 0.0 | 0.0 | 0.1 | 0.1 | 0.1 | 0.0 | 0.0 | 0.0 | 0.0 | ||
| 2002 | 0.0 | 0.0 | 0.0 | 0.0 | 0.3 | 0.0 | 0.0 | 0.0 | 0.0 | 0.1 | 0.1 | 0.0 | 0.0 | 0.1 | 0.0 | 0.1 | 0.1 | ||
| 2001 | 0.4 | 0.1 | 0.1 | 0.1 | 0.1 | 0.0 | 0.0 | 0.0 | 0.1 | 0.0 | 0.1 | 0.1 | 0.2 | 0.1 | 0.0 | 0.1 | 0.1 | ||
| 2000 | 0.0 | 0.1 | 0.0 | 0.0 | 0.0 | 0.0 | 0.1 | 0.1 | 0.1 | 0.1 | 0.0 | 0.1 | 0.1 | 0.0 | 0.1 | 0.1 | 0.1 | ||
| 1999 | 0.1 | 0.0 | 0.0 | 0.0 | 0.0 | 0.0 | 0.0 | 0.2 | 0.1 | 0.0 | 0.2 | 0.0 | 0.0 | 0.0 | 0.1 | 0.1 | 0.1 | ||
| 1998 | 0.0 | 0.1 | 0.0 | 0.0 | 0.0 | 0.0 | 0.1 | 0.0 | 0.0 | 0.1 | 0.1 | 0.2 | 0.1 | 0.0 | 0.0 | 0.1 | 0.0 | ||
| 1997 | 0.0 | 0.1 | 0.0 | 0.0 | 0.0 | 0.0 | 0.0 | 0.0 | 0.0 | 0.1 | 0.1 | 0.0 | 0.0 | 0.0 | 0.0 | 0.1 | 0.0 | ||
| 1996 | 0.2 | 0.0 | 0.3 | 0.0 | 0.1 | 0.2 | 0.0 | 0.0 | 0.0 | 0.0 | 0.1 | 0.1 | 0.1 | 0.1 | 0.1 | 0.0 | 0.1 | ||
| 1995 | 0.2 | 0.0 | 0.0 | 0.1 | 0.1 | 0.1 | 0.0 | 0.0 | 0.3 | 0.0 | 0.3 | 0.1 | 0.1 | 0.1 | 0.1 | 0.2 | 0.1 | ||
| 1994 | 0.1 | 0.3 | 0.0 | 0.0 | 0.0 | 0.0 | 0.0 | 0.0 | 0.1 | 0.1 | 0.1 | 0.1 | 0.2 | 0.0 | 0.0 | 0.1 | 0.1 | ||
| 1993 | 0.1 | 0.2 | 0.0 | 0.0 | 0.0 | 0.0 | 0.0 | 0.0 | 0.0 | 0.0 | 0.1 | 0.2 | 0.1 | 0.0 | 0.0 | 0.0 | 0.1 | ||
| 1992 | 0.0 | 0.0 | 0.0 | 0.0 | 0.0 | 0.2 | 0.2 | 0.0 | 0.2 | 0.0 | 0.1 | 0.2 | 0.1 | 0.0 | 0.1 | 0.1 | 0.1 | ||
| 1991 | 0.0 | 0.1 | 0.0 | 0.2 | 0.0 | 0.1 | 0.1 | 0.3 | 0.1 | 0.0 | 0.1 | 0.1 | 0.1 | 0.1 | 0.1 | 0.1 | 0.1 | ||
| 1990 | 0.0 | 0.0 | 0.0 | 0.0 | 0.0 | 0.0 | 0.0 | 0.0 | 0.1 | 0.0 | 0.1 | 0.2 | 0.1 | 0.0 | 0.0 | 0.1 | 0.0 | ||
| 1989 | 0.0 | 0.0 | 0.0 | 0.0 | 0.0 | 0.0 | 0.0 | 0.0 | 0.0 | 0.0 | 0.0 | 0.0 | 0.0 | 0.0 | 0.0 | 0.0 | 0.0 | ||
| 1988 | 0.0 | 0.0 | 0.0 | 0.0 | 0.0 | 0.0 | 0.0 | 0.0 | 0.0 | 0.1 | 0.0 | 0.1 | 0.0 | 0.0 | 0.0 | 0.0 | 0.0 | ||
| 1987 | 0.0 | 0.0 | 0.0 | 0.0 | 0.0 | 0.0 | 0.0 | 0.0 | 0.0 | 0.0 | 0.1 | 0.0 | 0.0 | 0.0 | 0.0 | 0.0 | 0.0 | ||
| 1986 | 0.0 | 0.4 | 0.2 | 0.1 | 0.8 | 0.1 | 0.3 | 0.1 | 0.2 | 0.7 | 0.1 | 0.3 | 0.3 | 0.4 | 0.1 | 0.4 | 0.3 | ||
| 1985 | 0.0 | 0.0 | 0.1 | 0.0 | 0.0 | 0.0 | 0.0 | 0.0 | 0.0 | 0.0 | 0.1 | 0.0 | 0.0 | 0.0 | 0.0 | 0.0 | 0.0 | ||
| 1984 | 0.0 | 0.0 | 0.0 | 0.0 | 0.0 | 0.0 | 0.0 | 0.0 | 0.0 | 0.0 | 0.0 | 0.0 | 0.0 | 0.0 | 0.0 | 0.0 | 0.0 | ||
| 1983 | 0.0 | 0.0 | 0.0 | 0.1 | 0.4 | 0.1 | 0.0 | 0.0 | 0.0 | - | 0.0 | 0.0 | 0.0 | 0.2 | 0.0 | 0.0 | 0.1 | ||
| 1982 | - | 0.0 | - | 0.0 | 0.0 | 0.0 | - | 0.0 | - | 0.0 | - | 0.0 | 0.0 | 0.0 | 0.0 | 0.0 | 0.0 | ||
Reporting rates
Reporting rate is the proportion of all surveys in which the species was present.
Reporting rate by year
This chart shows the reporting rate of Yellow Thornbill each year between 1982 and 2017. 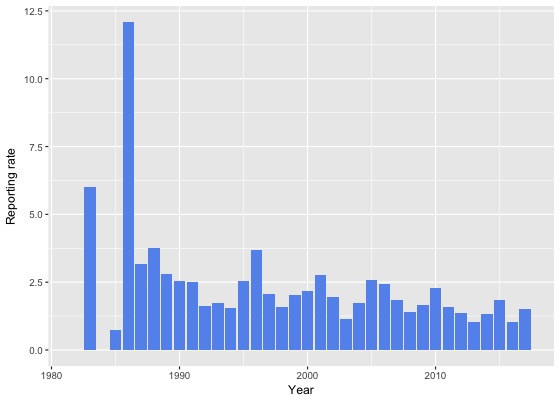
Reporting rate by month
This chart shows the reporting rate by month of Yellow Thornbill. The blue lines show the reporting rate for the twelve months to June 2017 and the bars show the average reporting rate for the period 1982 to 2017. 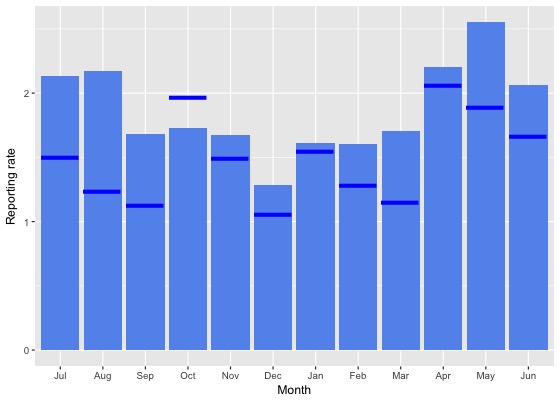
Reporting rate by season
This chart shows the seasonal reporting rate of Yellow Thornbill. The blue lines show the seasonal reporting rate for the twelve months to June 2017 and the bars show the average seasonal reporting rate for the period 1982 to 2017. 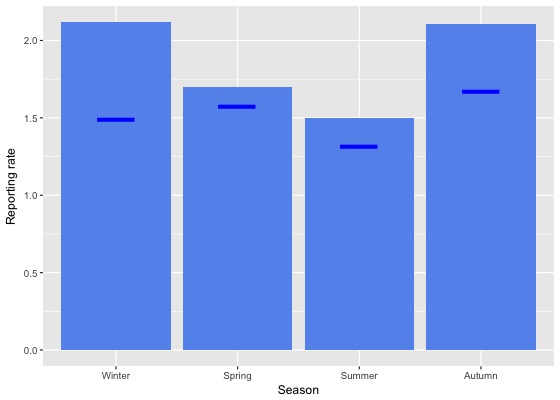
Reporting rate data
| Month | Season | ||||||||||||||||||
|---|---|---|---|---|---|---|---|---|---|---|---|---|---|---|---|---|---|---|---|
| Period | Jul | Aug | Sep | Oct | Nov | Dec | Jan | Feb | Mar | Apr | May | Jun | Winter | Spring | Summer | Autumn | All | ||
| All years | |||||||||||||||||||
| All | 2.1 | 2.2 | 1.7 | 1.7 | 1.7 | 1.3 | 1.6 | 1.6 | 1.7 | 2.2 | 2.6 | 2.1 | 2.1 | 1.7 | 1.5 | 2.1 | 1.8 | ||
| Previous years | |||||||||||||||||||
| All previous years | 2.2 | 2.4 | 1.8 | 1.7 | 1.7 | 1.3 | 1.6 | 1.7 | 1.8 | 2.2 | 2.7 | 2.1 | 2.2 | 1.7 | 1.5 | 2.2 | 1.9 | ||
| Previous 30 years | 2.2 | 2.3 | 1.7 | 1.7 | 1.5 | 1.3 | 1.6 | 1.7 | 1.8 | 2.1 | 2.7 | 2.1 | 2.2 | 1.6 | 1.5 | 2.1 | 1.8 | ||
| Previous 20 years | 2.0 | 2.2 | 1.5 | 1.5 | 1.5 | 1.1 | 1.5 | 1.4 | 1.6 | 1.9 | 2.4 | 1.8 | 2.0 | 1.5 | 1.3 | 1.9 | 1.6 | ||
| 10 year groups | |||||||||||||||||||
| [2007,2017) | 1.9 | 2.0 | 1.2 | 1.4 | 1.3 | 1.1 | 1.3 | 1.4 | 1.2 | 1.7 | 2.0 | 1.5 | 1.8 | 1.3 | 1.2 | 1.6 | 1.4 | ||
| [1997,2007) | 2.2 | 2.5 | 2.0 | 1.9 | 1.8 | 1.1 | 2.2 | 1.5 | 2.4 | 2.4 | 3.6 | 2.4 | 2.3 | 1.9 | 1.5 | 2.7 | 2.1 | ||
| [1987,1997) | 3.2 | 2.9 | 2.6 | 2.9 | 1.7 | 2.7 | 2.3 | 2.8 | 2.9 | 3.2 | 3.6 | 3.9 | 3.3 | 2.4 | 2.6 | 3.2 | 2.8 | ||
| 5 year groups | |||||||||||||||||||
| [2012,2017) | 1.5 | 1.9 | 1.3 | 1.3 | 1.2 | 1.0 | 1.1 | 1.2 | 1.1 | 1.5 | 1.5 | 1.5 | 1.6 | 1.3 | 1.1 | 1.3 | 1.3 | ||
| [2007,2012) | 2.9 | 2.3 | 1.0 | 1.5 | 1.6 | 1.2 | 1.9 | 2.2 | 1.5 | 2.1 | 3.2 | 1.7 | 2.1 | 1.4 | 1.6 | 2.1 | 1.7 | ||
| [2002,2007) | 1.4 | 2.3 | 1.9 | 1.8 | 1.9 | 1.1 | 2.4 | 1.1 | 2.4 | 2.2 | 3.8 | 2.1 | 1.9 | 1.9 | 1.5 | 2.7 | 2.0 | ||
| [1997,2002) | 3.3 | 2.8 | 2.1 | 2.0 | 1.8 | 1.1 | 1.9 | 2.0 | 2.5 | 2.6 | 3.4 | 2.7 | 2.9 | 2.0 | 1.6 | 2.7 | 2.2 | ||
| [1992,1997) | 3.4 | 3.0 | 3.3 | 0.9 | 1.6 | 2.6 | 0.5 | 0.7 | 3.2 | 2.5 | 2.7 | 3.5 | 3.3 | 1.8 | 1.3 | 2.8 | 2.3 | ||
| [1987,1992) | 3.1 | 2.8 | 2.3 | 3.9 | 1.8 | 2.7 | 3.2 | 3.6 | 2.7 | 3.5 | 4.1 | 4.1 | 3.3 | 2.6 | 3.2 | 3.4 | 3.1 | ||
| Year | |||||||||||||||||||
| 2017 | 1.5 | 1.2 | 1.1 | 2.0 | 1.5 | 1.1 | 1.6 | 1.3 | 1.1 | 2.1 | 1.9 | 1.7 | 1.5 | 1.6 | 1.3 | 1.7 | 1.5 | ||
| 2016 | 1.2 | 1.6 | 1.1 | 0.9 | 0.3 | 0.7 | 0.9 | 1.4 | 1.0 | 1.3 | 1.3 | 0.4 | 1.1 | 0.8 | 1.0 | 1.2 | 1.0 | ||
| 2015 | 1.9 | 4.3 | 2.5 | 1.9 | 2.4 | 1.8 | 1.4 | 1.0 | 1.8 | 1.6 | 0.9 | 1.3 | 2.3 | 2.2 | 1.4 | 1.5 | 1.8 | ||
| 2014 | 1.8 | 0.8 | 0.5 | 0.6 | 0.7 | 2.1 | 1.4 | 1.2 | 0.4 | 2.0 | 2.6 | 2.6 | 1.9 | 0.6 | 1.5 | 1.5 | 1.3 | ||
| 2013 | 1.4 | 0.9 | 1.0 | 1.4 | 1.5 | 0.2 | 0.4 | 0.6 | 0.4 | 1.4 | 2.1 | 2.9 | 1.8 | 1.3 | 0.3 | 1.1 | 1.0 | ||
| 2012 | 1.6 | 0.8 | 0.7 | 1.7 | 0.8 | 0.5 | 1.3 | 2.0 | 1.8 | 1.7 | 2.1 | 1.5 | 1.3 | 1.2 | 1.2 | 1.8 | 1.3 | ||
| 2011 | 4.1 | 1.6 | 1.9 | 1.2 | 3.0 | 0.9 | 2.1 | 2.3 | 0.3 | 0.6 | 2.9 | 0.9 | 1.7 | 1.7 | 1.7 | 1.2 | 1.6 | ||
| 2010 | 4.2 | 4.4 | 1.1 | 1.9 | 1.4 | 0.7 | 1.4 | 3.5 | 2.4 | 3.8 | 2.0 | 3.8 | 4.0 | 1.6 | 1.4 | 2.9 | 2.3 | ||
| 2009 | 0.7 | 0.0 | 0.4 | 2.0 | 1.8 | 2.1 | 2.0 | 0.8 | 2.8 | 2.9 | 3.1 | 0.0 | 0.2 | 1.5 | 1.7 | 2.9 | 1.7 | ||
| 2008 | 2.8 | 1.7 | 0.4 | 1.0 | 1.3 | 1.4 | 1.6 | 1.9 | 1.1 | 1.6 | 4.5 | 0.9 | 1.7 | 0.9 | 1.5 | 1.9 | 1.4 | ||
| 2007 | 3.3 | 3.7 | 1.2 | 1.1 | 0.0 | 1.3 | 2.0 | 2.6 | 1.3 | 2.1 | 4.1 | 2.6 | 3.0 | 1.0 | 1.8 | 2.2 | 1.8 | ||
| 2006 | 2.6 | 3.9 | 1.3 | 1.5 | 1.2 | 0.6 | 3.4 | 2.2 | 4.4 | 1.6 | 2.9 | 3.4 | 3.3 | 1.4 | 2.0 | 3.3 | 2.4 | ||
| 2005 | 1.5 | 1.9 | 3.7 | 3.3 | 2.1 | 1.2 | 2.1 | 0.0 | 3.5 | 3.3 | 3.0 | 3.1 | 2.4 | 3.2 | 1.2 | 3.3 | 2.6 | ||
| 2004 | 0.4 | 3.3 | 2.4 | 0.6 | 1.7 | 1.4 | 2.4 | 2.0 | 1.0 | 2.2 | 4.9 | 0.6 | 1.2 | 1.6 | 1.9 | 2.3 | 1.7 | ||
| 2003 | 1.7 | 0.7 | 0.0 | 1.6 | 0.0 | 0.8 | 1.5 | 0.5 | 0.9 | 0.9 | 5.4 | 1.9 | 1.4 | 0.5 | 0.9 | 1.9 | 1.1 | ||
| 2002 | 1.7 | 1.7 | 2.0 | 2.1 | 4.5 | 1.2 | 2.5 | 0.7 | 0.9 | 3.6 | 3.5 | 0.5 | 1.3 | 2.8 | 1.4 | 2.3 | 2.0 | ||
| 2001 | 5.8 | 3.6 | 1.5 | 3.4 | 3.4 | 1.4 | 2.5 | 2.6 | 2.7 | 2.0 | 1.7 | 3.4 | 4.4 | 2.5 | 2.1 | 2.3 | 2.8 | ||
| 2000 | 2.4 | 2.0 | 2.3 | 1.3 | 0.9 | 1.0 | 2.5 | 1.9 | 3.3 | 3.5 | 2.7 | 2.7 | 2.4 | 1.5 | 1.7 | 3.3 | 2.2 | ||
| 1999 | 2.9 | 2.1 | 2.3 | 1.9 | 0.0 | 0.6 | 0.7 | 2.1 | 2.2 | 2.1 | 5.1 | 2.3 | 2.3 | 1.4 | 1.1 | 3.1 | 2.0 | ||
| 1998 | 0.0 | 3.8 | 2.4 | 1.1 | 1.8 | 0.9 | 1.5 | 0.0 | 0.0 | 2.6 | 3.7 | 2.7 | 2.4 | 1.8 | 0.9 | 1.3 | 1.6 | ||
| 1997 | 0.0 | 3.4 | 2.7 | 1.3 | 3.4 | 1.0 | 0.0 | 1.8 | 2.5 | 2.8 | 4.4 | 1.4 | 1.4 | 2.6 | 0.9 | 3.1 | 2.1 | ||
| 1996 | 6.0 | 4.3 | 13.3 | 0.9 | 3.7 | 7.1 | 0.0 | 1.2 | 2.0 | 1.6 | 1.7 | 4.6 | 4.8 | 5.1 | 2.8 | 1.8 | 3.7 | ||
| 1995 | 4.3 | 0.8 | 0.0 | 1.8 | 1.8 | 1.1 | 0.9 | 1.6 | 6.1 | 4.0 | 5.2 | 4.3 | 2.8 | 1.3 | 1.1 | 5.0 | 2.5 | ||
| 1994 | 3.9 | 5.2 | 1.5 | 0.0 | 0.7 | 0.0 | 0.0 | 0.0 | 2.3 | 2.3 | 1.2 | 1.1 | 3.2 | 0.7 | 0.0 | 2.0 | 1.5 | ||
| 1993 | 2.0 | 5.1 | 1.6 | 0.0 | 0.0 | 0.0 | 0.0 | 0.0 | 1.2 | 1.7 | 3.9 | 2.9 | 3.6 | 0.5 | 0.0 | 2.3 | 1.7 | ||
| 1992 | 0.0 | 0.0 | 1.2 | 1.1 | 1.4 | 1.6 | 1.7 | 0.0 | 4.2 | 1.7 | 1.3 | 5.0 | 1.7 | 1.2 | 1.2 | 2.4 | 1.6 | ||
| 1991 | 0.8 | 3.2 | 0.0 | 4.9 | 1.0 | 1.4 | 3.6 | 4.0 | 4.8 | 0.0 | 3.3 | 6.0 | 2.6 | 2.1 | 2.8 | 2.7 | 2.5 | ||
| 1990 | 2.6 | 3.2 | 0.0 | 0.0 | 0.9 | 0.0 | 4.2 | 4.2 | 4.5 | 1.2 | 4.1 | 6.6 | 3.6 | 0.3 | 2.8 | 3.3 | 2.6 | ||
| 1989 | 3.6 | 2.6 | 1.3 | 4.6 | 1.5 | 2.2 | 4.3 | 3.6 | 2.2 | 2.6 | 3.9 | 1.2 | 2.5 | 2.6 | 3.3 | 2.8 | 2.8 | ||
| 1988 | 4.3 | 2.2 | 3.9 | 3.9 | 2.4 | 2.6 | 3.0 | 4.6 | 3.5 | 6.4 | 3.0 | 6.3 | 4.1 | 3.3 | 3.3 | 4.3 | 3.8 | ||
| 1987 | 0.0 | 6.7 | 3.6 | 4.3 | 1.8 | 4.7 | 2.1 | 2.5 | 1.0 | 3.7 | 5.2 | 2.9 | 3.0 | 3.1 | 3.1 | 3.4 | 3.2 | ||
| 1986 | 3.8 | 7.9 | 17.0 | 8.3 | 19.1 | 5.9 | 13.0 | 8.3 | 9.7 | 25.5 | 6.9 | 5.7 | 6.1 | 15.4 | 8.6 | 16.2 | 12.1 | ||
| 1985 | 0.0 | 0.0 | 1.9 | 0.0 | 1.8 | 0.0 | 0.0 | 0.0 | 0.0 | 0.0 | 10.0 | 0.0 | 0.0 | 1.0 | 0.0 | 2.5 | 0.7 | ||
| 1984 | 0.0 | 0.0 | 0.0 | 0.0 | 0.0 | 0.0 | 0.0 | 0.0 | 0.0 | 0.0 | 0.0 | 0.0 | 0.0 | 0.0 | 0.0 | 0.0 | 0.0 | ||
| 1983 | 0.0 | 0.0 | 0.0 | 7.7 | 44.4 | 7.7 | 0.0 | 0.0 | 0.0 | - | 0.0 | 0.0 | 0.0 | 18.5 | 3.3 | 0.0 | 6.0 | ||
| 1982 | - | 0.0 | - | 0.0 | 0.0 | 0.0 | - | 0.0 | - | 0.0 | - | 0.0 | 0.0 | 0.0 | 0.0 | 0.0 | 0.0 | ||
Breeding data
Breeding records by month
Number of breeding records by breeding code and month, 2017 and all years| Breeding code | Jul | Aug | Sep | Oct | Nov | Dec | Jan | Feb | Mar | Apr | May | Jun |
|---|---|---|---|---|---|---|---|---|---|---|---|---|
| 2017 | ||||||||||||
| Breeding (BLA code) | 0 | 0 | 0 | 0 | 0 | 0 | 0 | 0 | 0 | 0 | 0 | 0 |
| Carrying Food | 0 | 0 | 0 | 0 | 0 | 0 | 0 | 0 | 0 | 0 | 0 | 0 |
| Copulating | 0 | 0 | 0 | 0 | 0 | 0 | 0 | 0 | 0 | 0 | 0 | 0 |
| Display | 0 | 0 | 0 | 0 | 0 | 0 | 0 | 0 | 0 | 0 | 0 | 0 |
| Dependent young | 0 | 0 | 0 | 0 | 1 | 0 | 1 | 0 | 0 | 0 | 0 | 0 |
| Faecal sac | 0 | 0 | 0 | 0 | 0 | 0 | 0 | 0 | 0 | 0 | 0 | 0 |
| Inspecting hollow | 0 | 1 | 0 | 1 | 0 | 0 | 0 | 0 | 0 | 0 | 0 | 0 |
| Nest building | 0 | 1 | 0 | 1 | 0 | 0 | 0 | 0 | 0 | 0 | 0 | 0 |
| Nest with eggs | 0 | 0 | 0 | 0 | 0 | 0 | 0 | 0 | 0 | 0 | 0 | 0 |
| Nest with young | 0 | 0 | 0 | 0 | 0 | 0 | 0 | 0 | 0 | 0 | 0 | 0 |
| On/leaving nest | 0 | 0 | 0 | 1 | 0 | 0 | 0 | 0 | 0 | 0 | 0 | 0 |
| All years | ||||||||||||
| Breeding (BLA code) | 0 | 0 | 0 | 0 | 0 | 0 | 0 | 0 | 1 | 0 | 0 | 0 |
| Carrying Food | 0 | 0 | 0 | 1 | 1 | 0 | 0 | 0 | 0 | 0 | 0 | 0 |
| Copulating | 0 | 0 | 0 | 0 | 0 | 0 | 0 | 0 | 0 | 0 | 0 | 0 |
| Display | 0 | 0 | 0 | 0 | 0 | 0 | 0 | 0 | 0 | 0 | 0 | 0 |
| Dependent young | 0 | 0 | 0 | 8 | 7 | 4 | 4 | 5 | 0 | 1 | 0 | 0 |
| Faecal sac | 0 | 0 | 0 | 0 | 0 | 0 | 0 | 0 | 0 | 0 | 0 | 0 |
| Inspecting hollow | 0 | 1 | 0 | 1 | 0 | 0 | 0 | 0 | 0 | 0 | 0 | 0 |
| Nest building | 0 | 2 | 1 | 2 | 0 | 0 | 2 | 0 | 0 | 0 | 0 | 0 |
| Nest with eggs | 0 | 0 | 0 | 0 | 0 | 0 | 0 | 0 | 0 | 0 | 0 | 0 |
| Nest with young | 0 | 0 | 0 | 0 | 1 | 0 | 0 | 0 | 0 | 0 | 0 | 0 |
| On/leaving nest | 0 | 0 | 0 | 1 | 0 | 0 | 0 | 0 | 0 | 0 | 0 | 0 |
Breeding records by year
Average number of breeding records per period by breeding code| Period | Breeding (BLA code) | Carrying Food | Copulating | Display | Dependent young | Faecal sac | Inspecting hollow | Nest building | Nest with eggs | Nest with young | On/leaving nest |
|---|---|---|---|---|---|---|---|---|---|---|---|
| All years | |||||||||||
| All | 0.0 | 0.1 | 0.0 | 0.0 | 0.8 | 0.0 | 0.1 | 0.2 | 0.0 | 0.0 | 0.0 |
| Previous years | |||||||||||
| All previous years | 0.0 | 0.1 | 0.0 | 0.0 | 0.8 | 0.0 | 0.0 | 0.1 | 0.0 | 0.0 | 0.0 |
| Previous 30 years | 0.0 | 0.1 | 0.0 | 0.0 | 0.9 | 0.0 | 0.0 | 0.1 | 0.0 | 0.0 | 0.0 |
| Previous 20 years | 0.0 | 0.1 | 0.0 | 0.0 | 1.0 | 0.0 | 0.0 | 0.1 | 0.0 | 0.0 | 0.0 |
| 10 year groups | |||||||||||
| [2007,2017) | 0.0 | 0.1 | 0.0 | 0.0 | 1.8 | 0.0 | 0.0 | 0.1 | 0.0 | 0.1 | 0.0 |
| [1997,2007) | 0.1 | 0.1 | 0.0 | 0.0 | 0.2 | 0.0 | 0.0 | 0.1 | 0.0 | 0.0 | 0.0 |
| [1987,1997) | 0.0 | 0.0 | 0.0 | 0.0 | 0.7 | 0.0 | 0.0 | 0.1 | 0.0 | 0.0 | 0.0 |
| 5 year groups | |||||||||||
| [2012,2017) | 0.0 | 0.0 | 0.0 | 0.0 | 2.0 | 0.0 | 0.0 | 0.0 | 0.0 | 0.2 | 0.0 |
| [2007,2012) | 0.0 | 0.2 | 0.0 | 0.0 | 1.6 | 0.0 | 0.0 | 0.2 | 0.0 | 0.0 | 0.0 |
| [2002,2007) | 0.0 | 0.2 | 0.0 | 0.0 | 0.0 | 0.0 | 0.0 | 0.2 | 0.0 | 0.0 | 0.0 |
| [1997,2002) | 0.2 | 0.0 | 0.0 | 0.0 | 0.4 | 0.0 | 0.0 | 0.0 | 0.0 | 0.0 | 0.0 |
| [1992,1997) | 0.0 | 0.0 | 0.0 | 0.0 | 0.0 | 0.0 | 0.0 | 0.0 | 0.0 | 0.0 | 0.0 |
| [1987,1992) | 0.0 | 0.0 | 0.0 | 0.0 | 1.4 | 0.0 | 0.0 | 0.2 | 0.0 | 0.0 | 0.0 |
| Year | |||||||||||
| 2017 | 0.0 | 0.0 | 0.0 | 0.0 | 2.0 | 0.0 | 2.0 | 2.0 | 0.0 | 0.0 | 1.0 |
| 2016 | 0.0 | 0.0 | 0.0 | 0.0 | 0.0 | 0.0 | 0.0 | 0.0 | 0.0 | 1.0 | 0.0 |
| 2015 | 0.0 | 0.0 | 0.0 | 0.0 | 1.0 | 0.0 | 0.0 | 0.0 | 0.0 | 0.0 | 0.0 |
| 2014 | 0.0 | 0.0 | 0.0 | 0.0 | 2.0 | 0.0 | 0.0 | 0.0 | 0.0 | 0.0 | 0.0 |
| 2013 | 0.0 | 0.0 | 0.0 | 0.0 | 4.0 | 0.0 | 0.0 | 0.0 | 0.0 | 0.0 | 0.0 |
| 2012 | 0.0 | 0.0 | 0.0 | 0.0 | 3.0 | 0.0 | 0.0 | 0.0 | 0.0 | 0.0 | 0.0 |
| 2011 | 0.0 | 0.0 | 0.0 | 0.0 | 2.0 | 0.0 | 0.0 | 0.0 | 0.0 | 0.0 | 0.0 |
| 2010 | 0.0 | 1.0 | 0.0 | 0.0 | 1.0 | 0.0 | 0.0 | 0.0 | 0.0 | 0.0 | 0.0 |
| 2009 | 0.0 | 0.0 | 0.0 | 0.0 | 2.0 | 0.0 | 0.0 | 0.0 | 0.0 | 0.0 | 0.0 |
| 2008 | 0.0 | 0.0 | 0.0 | 0.0 | 3.0 | 0.0 | 0.0 | 0.0 | 0.0 | 0.0 | 0.0 |
| 2007 | 0.0 | 0.0 | 0.0 | 0.0 | 0.0 | 0.0 | 0.0 | 1.0 | 0.0 | 0.0 | 0.0 |
| 2006 | 0.0 | 0.0 | 0.0 | 0.0 | 0.0 | 0.0 | 0.0 | 1.0 | 0.0 | 0.0 | 0.0 |
| 2005 | 0.0 | 1.0 | 0.0 | 0.0 | 0.0 | 0.0 | 0.0 | 0.0 | 0.0 | 0.0 | 0.0 |
| 2004 | 0.0 | 0.0 | 0.0 | 0.0 | 0.0 | 0.0 | 0.0 | 0.0 | 0.0 | 0.0 | 0.0 |
| 2003 | 0.0 | 0.0 | 0.0 | 0.0 | 0.0 | 0.0 | 0.0 | 0.0 | 0.0 | 0.0 | 0.0 |
| 2002 | 0.0 | 0.0 | 0.0 | 0.0 | 0.0 | 0.0 | 0.0 | 0.0 | 0.0 | 0.0 | 0.0 |
| 2001 | 0.0 | 0.0 | 0.0 | 0.0 | 0.0 | 0.0 | 0.0 | 0.0 | 0.0 | 0.0 | 0.0 |
| 2000 | 1.0 | 0.0 | 0.0 | 0.0 | 1.0 | 0.0 | 0.0 | 0.0 | 0.0 | 0.0 | 0.0 |
| 1999 | 0.0 | 0.0 | 0.0 | 0.0 | 0.0 | 0.0 | 0.0 | 0.0 | 0.0 | 0.0 | 0.0 |
| 1998 | 0.0 | 0.0 | 0.0 | 0.0 | 0.0 | 0.0 | 0.0 | 0.0 | 0.0 | 0.0 | 0.0 |
| 1997 | 0.0 | 0.0 | 0.0 | 0.0 | 1.0 | 0.0 | 0.0 | 0.0 | 0.0 | 0.0 | 0.0 |
| 1996 | 0.0 | 0.0 | 0.0 | 0.0 | 0.0 | 0.0 | 0.0 | 0.0 | 0.0 | 0.0 | 0.0 |
| 1995 | 0.0 | 0.0 | 0.0 | 0.0 | 0.0 | 0.0 | 0.0 | 0.0 | 0.0 | 0.0 | 0.0 |
| 1994 | 0.0 | 0.0 | 0.0 | 0.0 | 0.0 | 0.0 | 0.0 | 0.0 | 0.0 | 0.0 | 0.0 |
| 1993 | 0.0 | 0.0 | 0.0 | 0.0 | 0.0 | 0.0 | 0.0 | 0.0 | 0.0 | 0.0 | 0.0 |
| 1992 | 0.0 | 0.0 | 0.0 | 0.0 | 0.0 | 0.0 | 0.0 | 0.0 | 0.0 | 0.0 | 0.0 |
| 1991 | 0.0 | 0.0 | 0.0 | 0.0 | 0.0 | 0.0 | 0.0 | 0.0 | 0.0 | 0.0 | 0.0 |
| 1990 | 0.0 | 0.0 | 0.0 | 0.0 | 1.0 | 0.0 | 0.0 | 0.0 | 0.0 | 0.0 | 0.0 |
| 1989 | 0.0 | 0.0 | 0.0 | 0.0 | 1.0 | 0.0 | 0.0 | 1.0 | 0.0 | 0.0 | 0.0 |
| 1988 | 0.0 | 0.0 | 0.0 | 0.0 | 3.0 | 0.0 | 0.0 | 0.0 | 0.0 | 0.0 | 0.0 |
| 1987 | 0.0 | 0.0 | 0.0 | 0.0 | 2.0 | 0.0 | 0.0 | 0.0 | 0.0 | 0.0 | 0.0 |
| 1986 | 0.0 | 0.0 | 0.0 | 0.0 | 0.0 | 0.0 | 0.0 | 2.0 | 0.0 | 0.0 | 0.0 |
| 1985 | 0.0 | 0.0 | 0.0 | 0.0 | 0.0 | 0.0 | 0.0 | 0.0 | 0.0 | 0.0 | 0.0 |
| 1984 | 0.0 | 0.0 | 0.0 | 0.0 | 0.0 | 0.0 | 0.0 | 0.0 | 0.0 | 0.0 | 0.0 |
| 1983 | 0.0 | 0.0 | 0.0 | 0.0 | 0.0 | 0.0 | 0.0 | 0.0 | 0.0 | 0.0 | 0.0 |
| 1982 | 0.0 | 0.0 | 0.0 | 0.0 | 0.0 | 0.0 | 0.0 | 0.0 | 0.0 | 0.0 | 0.0 |
Distribution map
Distribution - 2017
This map shows the observed distribution of the Yellow Thornbill for 2017.
The red circles are the grid cells where Yellow Thornbill have been reported.
The transparency of the red circles indicate how many surveys sheets were submitted for that grid cell; the darker the red the more reliable the data. Of the 315 grid cells with reports, 83 had only one sheet; an example is grid number J3.
The size of the circle represents the reporting rate. The maximum reporting rate for Yellow Thornbill was 100.0% (eg grid number J3) and the minimum was 0.1% (eg grid number J14). 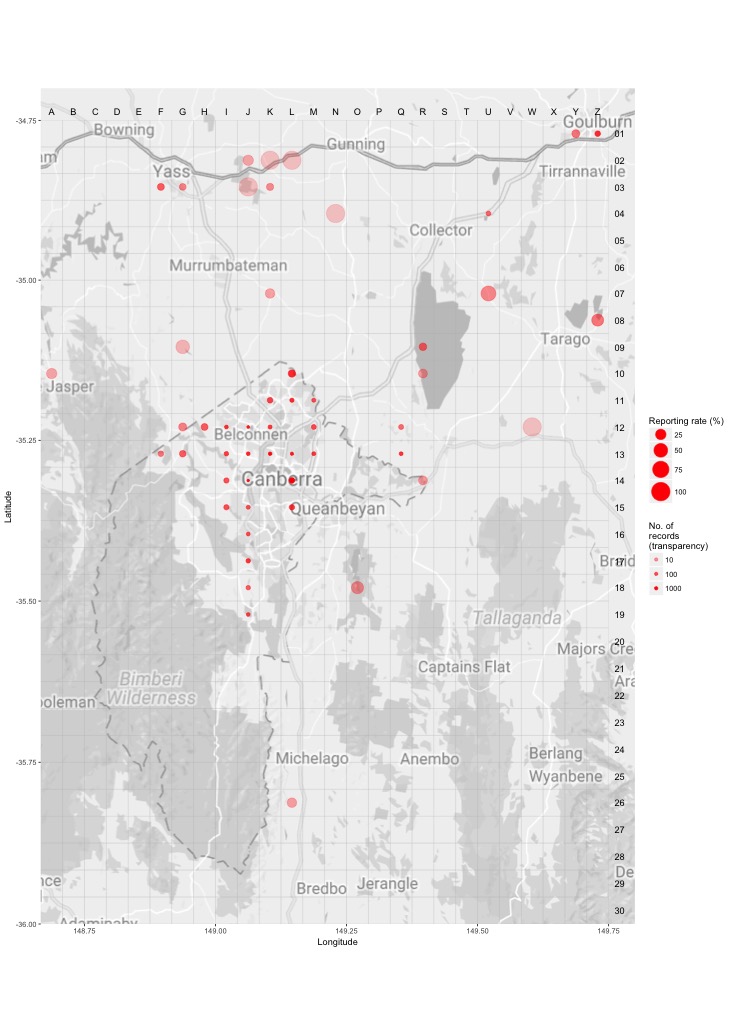
Distribution - all years
This map shows the observed distribution of the Yellow Thornbill for all years.
The red circles are the grid cells where Yellow Thornbill have been reported.
The transparency of the red circles indicate how many surveys sheets were submitted for that grid cell; the darker the red the more reliable the data. Of the 703 grid cells with reports, 55 had only one sheet; an example is grid number W3.
The size of the circle represents the reporting rate. The maximum reporting rate for Yellow Thornbill was 100.0% (eg grid number W3) and the minimum was 0.1% (eg grid number L25). 
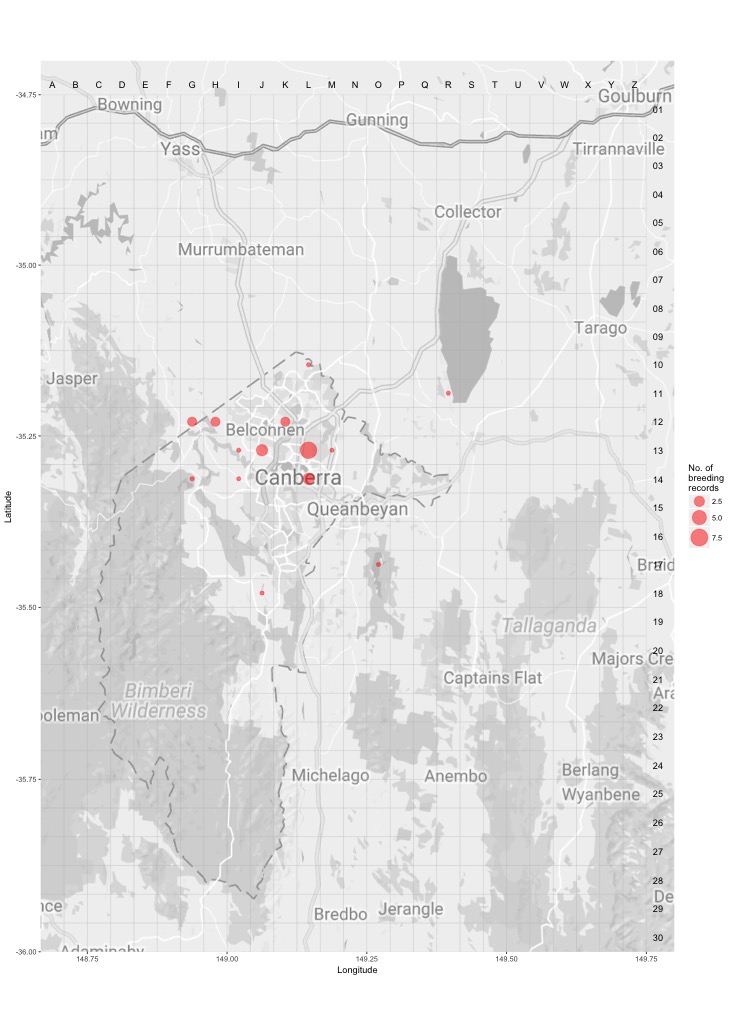
Breeding map
Breeding - 2017
This map shows the breeding distribution of the Yellow Thornbill for 2017.
The red circles are the grid cells where breeding activity for Yellow Thornbill have been reported.
The size of the circle represents the number of reports. 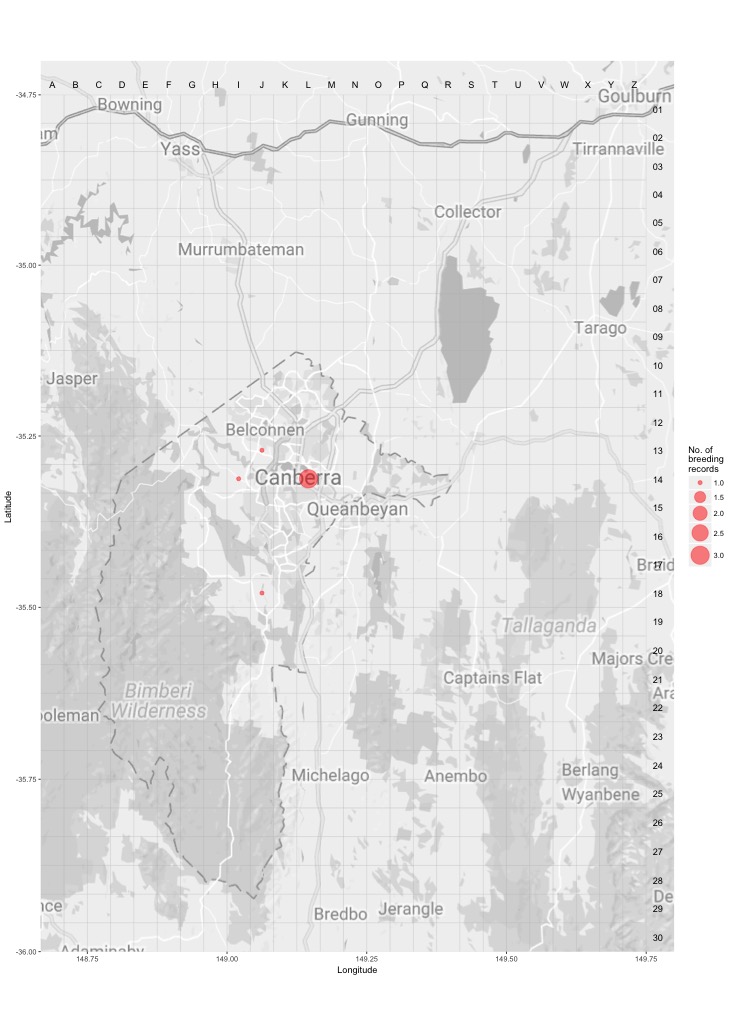
Breeding - all years
This map shows the breeding distribution of the Yellow Thornbill for all years.
The red circles are the grid cells where breeding activity for Yellow Thornbill have been reported.
The size of the circle represents the number of reports.